Dashboard
Introduction
This documentation explains the GreenIT dashboard views and provides examples of the data that can be displayed.
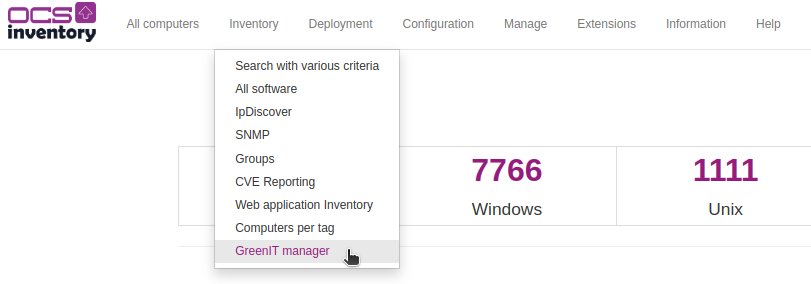
To access the dashboard, go to Inventory >> GreenIT Manager :
Then on the left side, you'll have this menu:

As you can see, there are 5 different statistic views:
- Global
(Overview of your IT infrastructure)
- Filtered
(Statistics for group of assets, based on filters)
- Operating system
(Statistics per operating system)
- Computer type
(Statistics per computer type)
- Manufacturer
(Statistics per manufacturer)
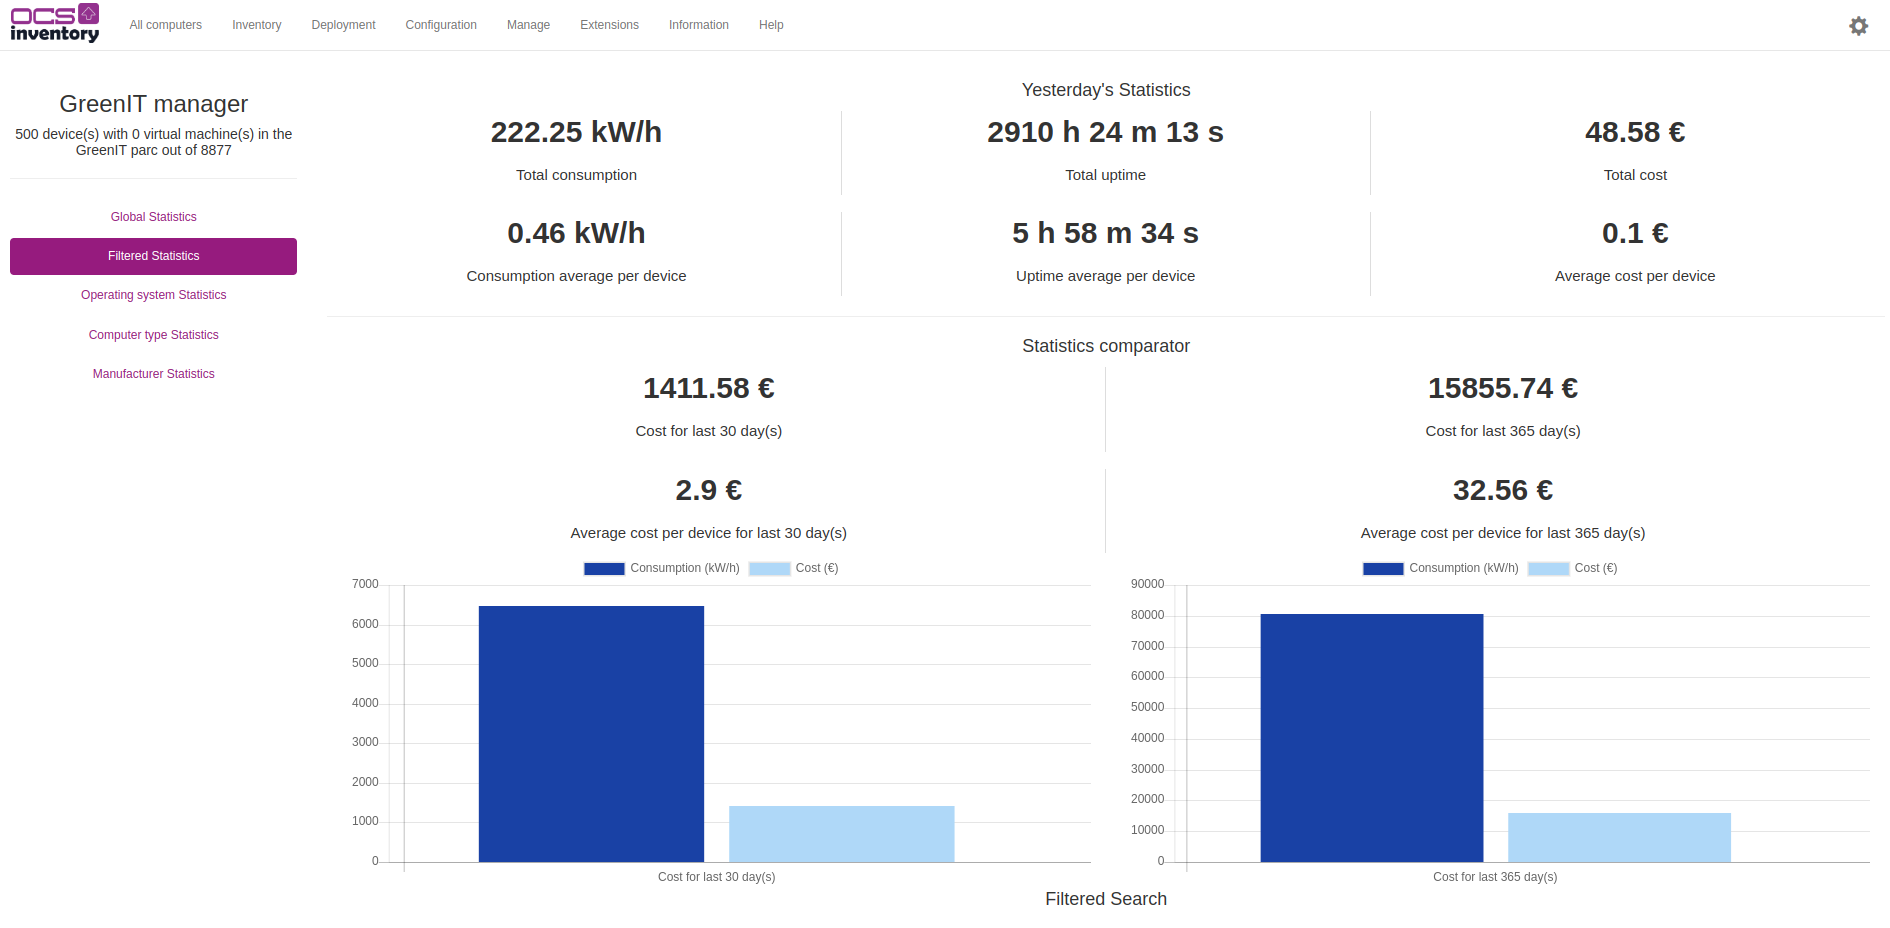
The global statistics
This is the global statistics and the default view of your IT infrastructure.
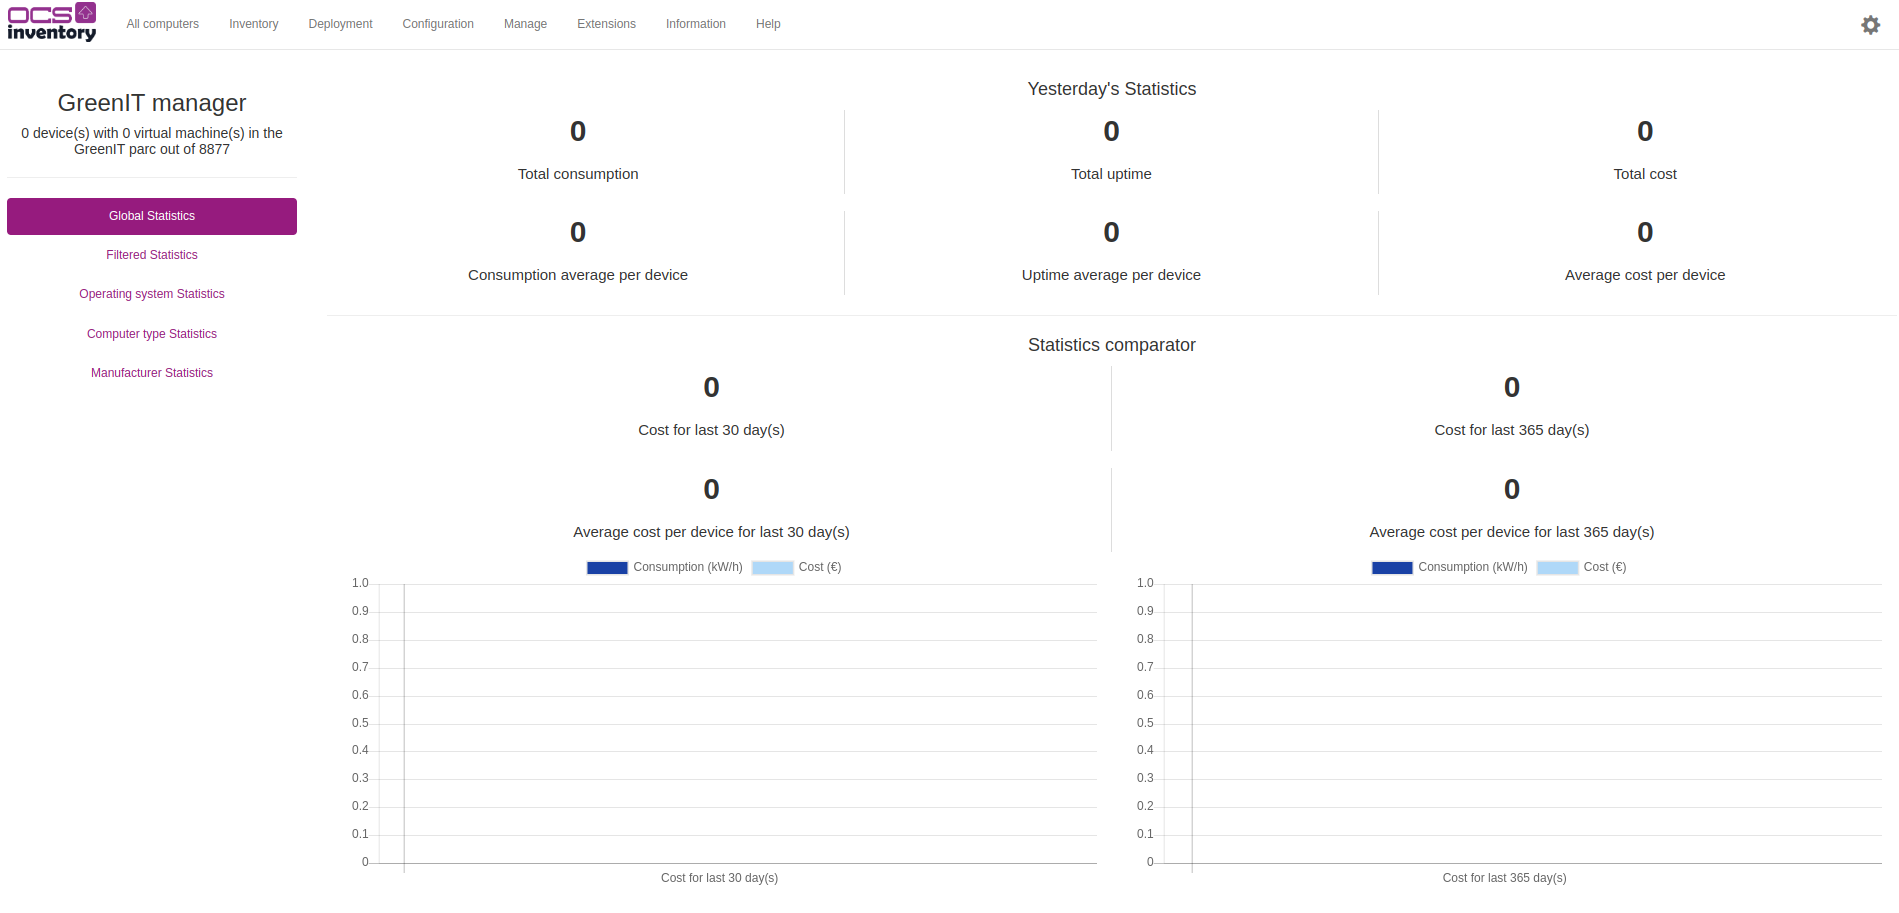
It displays two blocks: - Yesterday's statistics - Statistics comparator
The "yesterday's statistics" block has 3 parts: - Consumption - Uptime - Cost
Each block has a total and an average of the data.
Whereas the statistics comparator has a cost part and a graphical view, which compares the total consumption with the cost. Two time periods are used for comparison, their length can be changed in the configuration page.
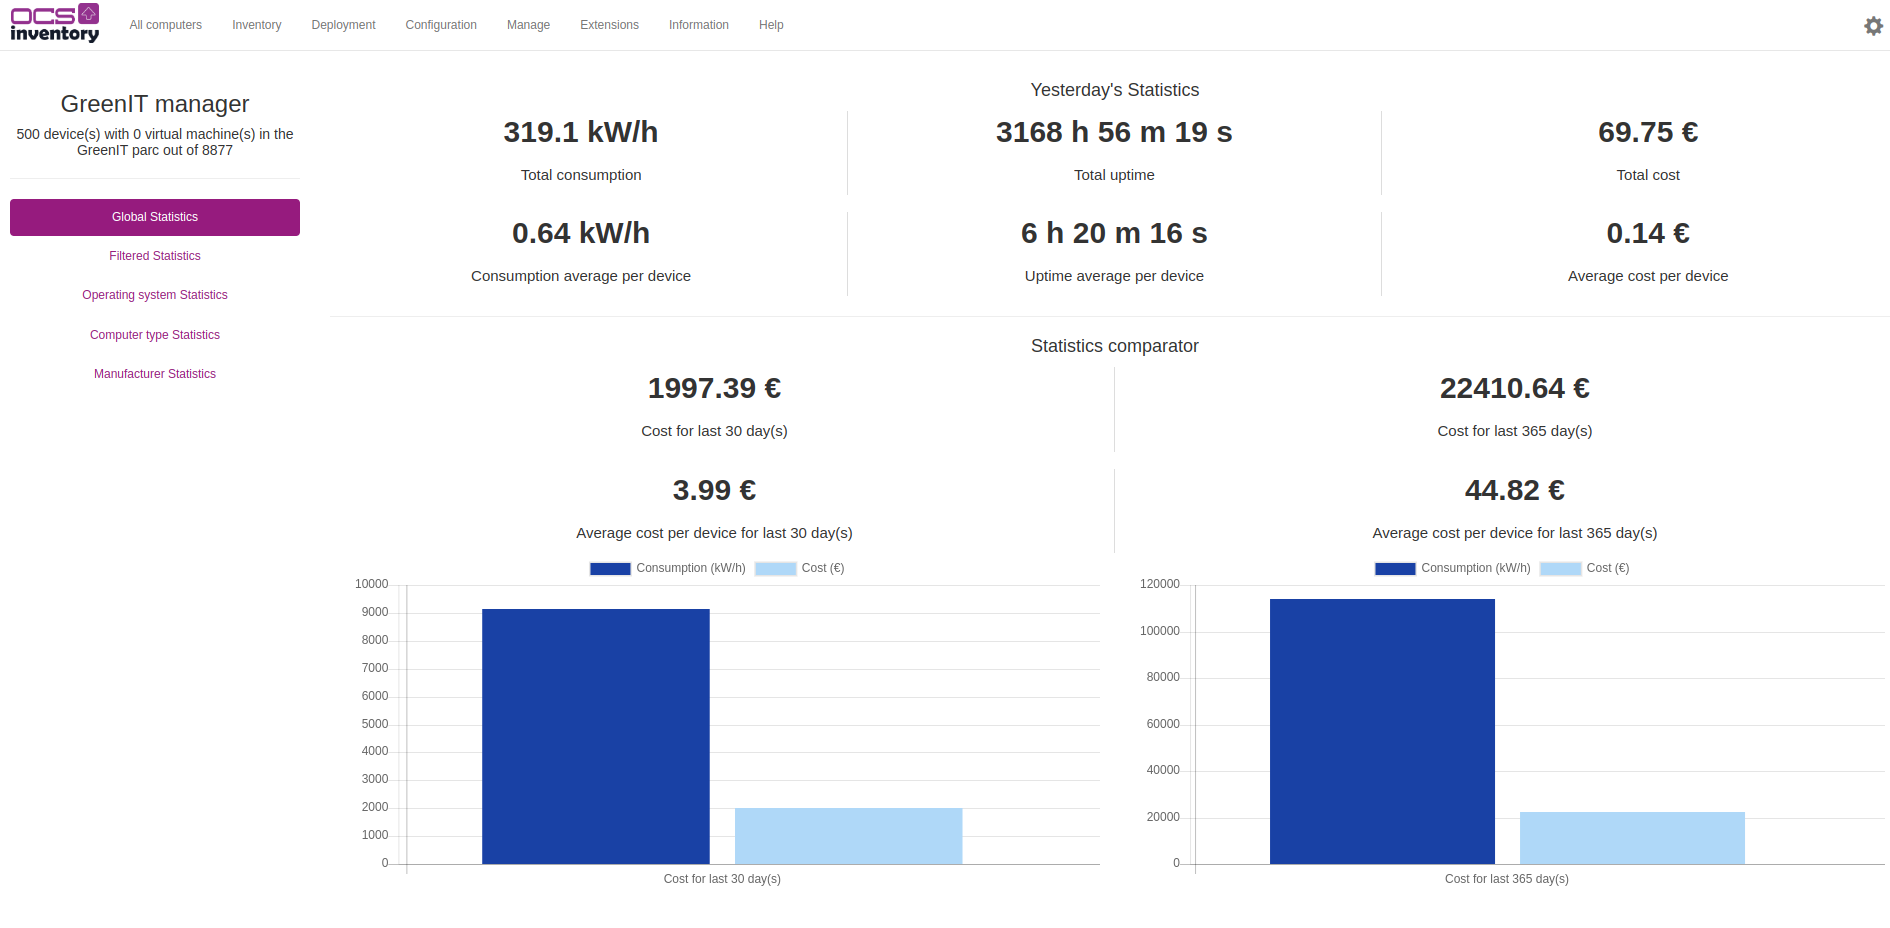
Example of the global statistic view with data:
Filtered statistics
The filtered view allows you to filter the global data. The OCS-Inventory filters are used to filter by assets category, groups, operating system or tags.
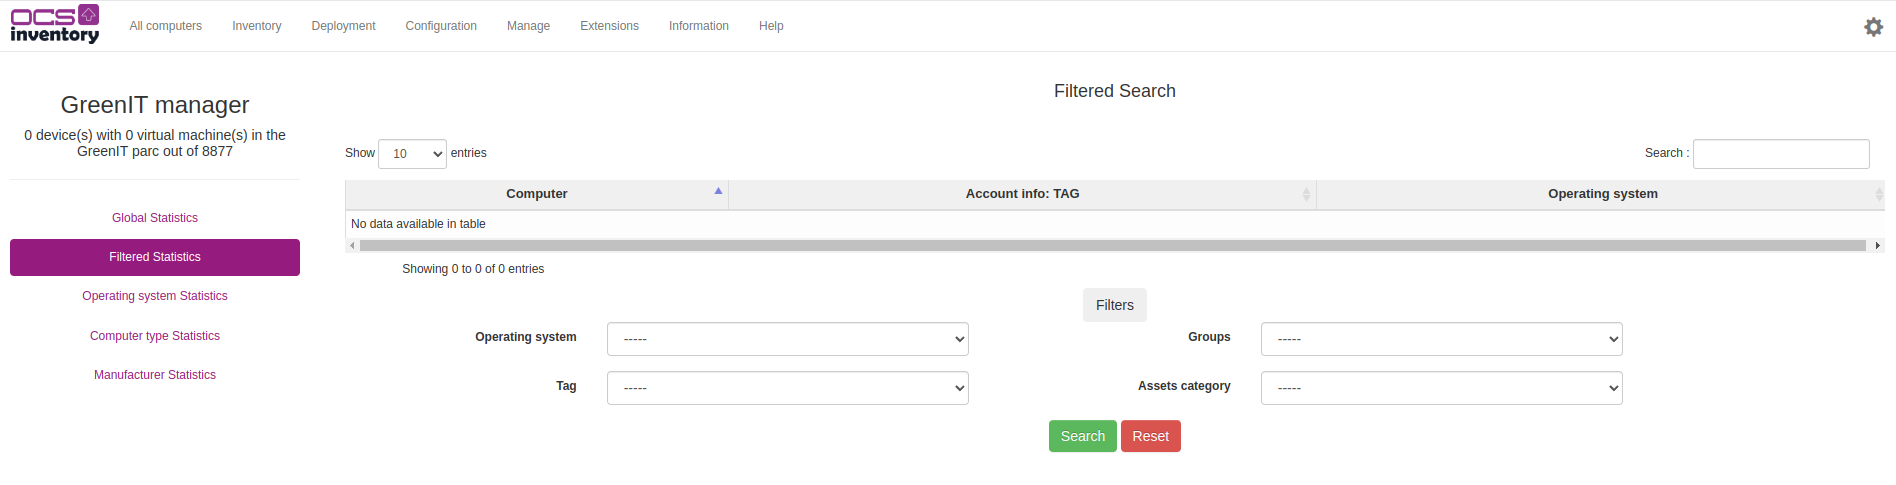
If the cronjob has been runned and data is available, the page should display a table similar to this one :
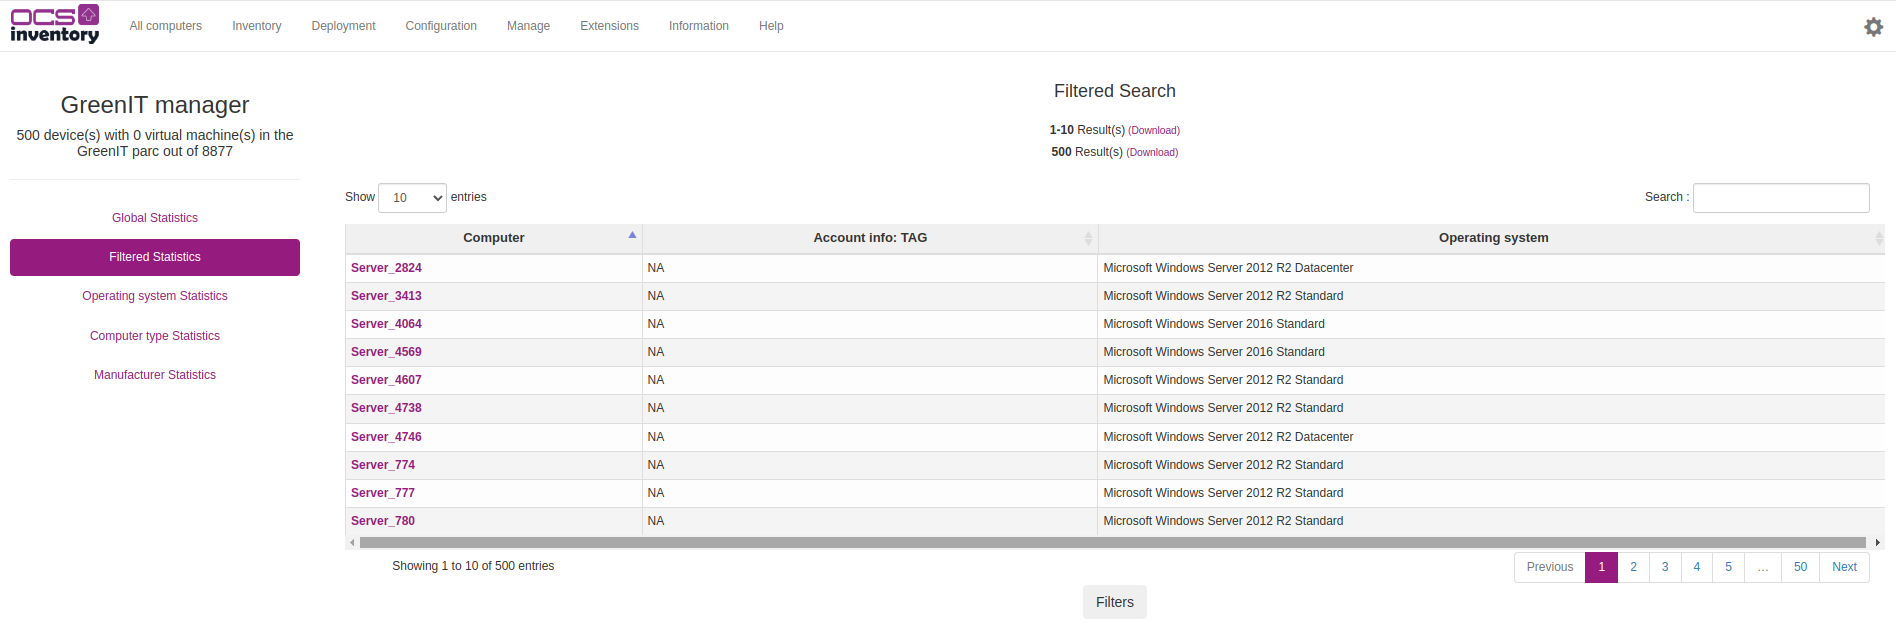
By clicking on a computer's name, you can access detailed data about it :
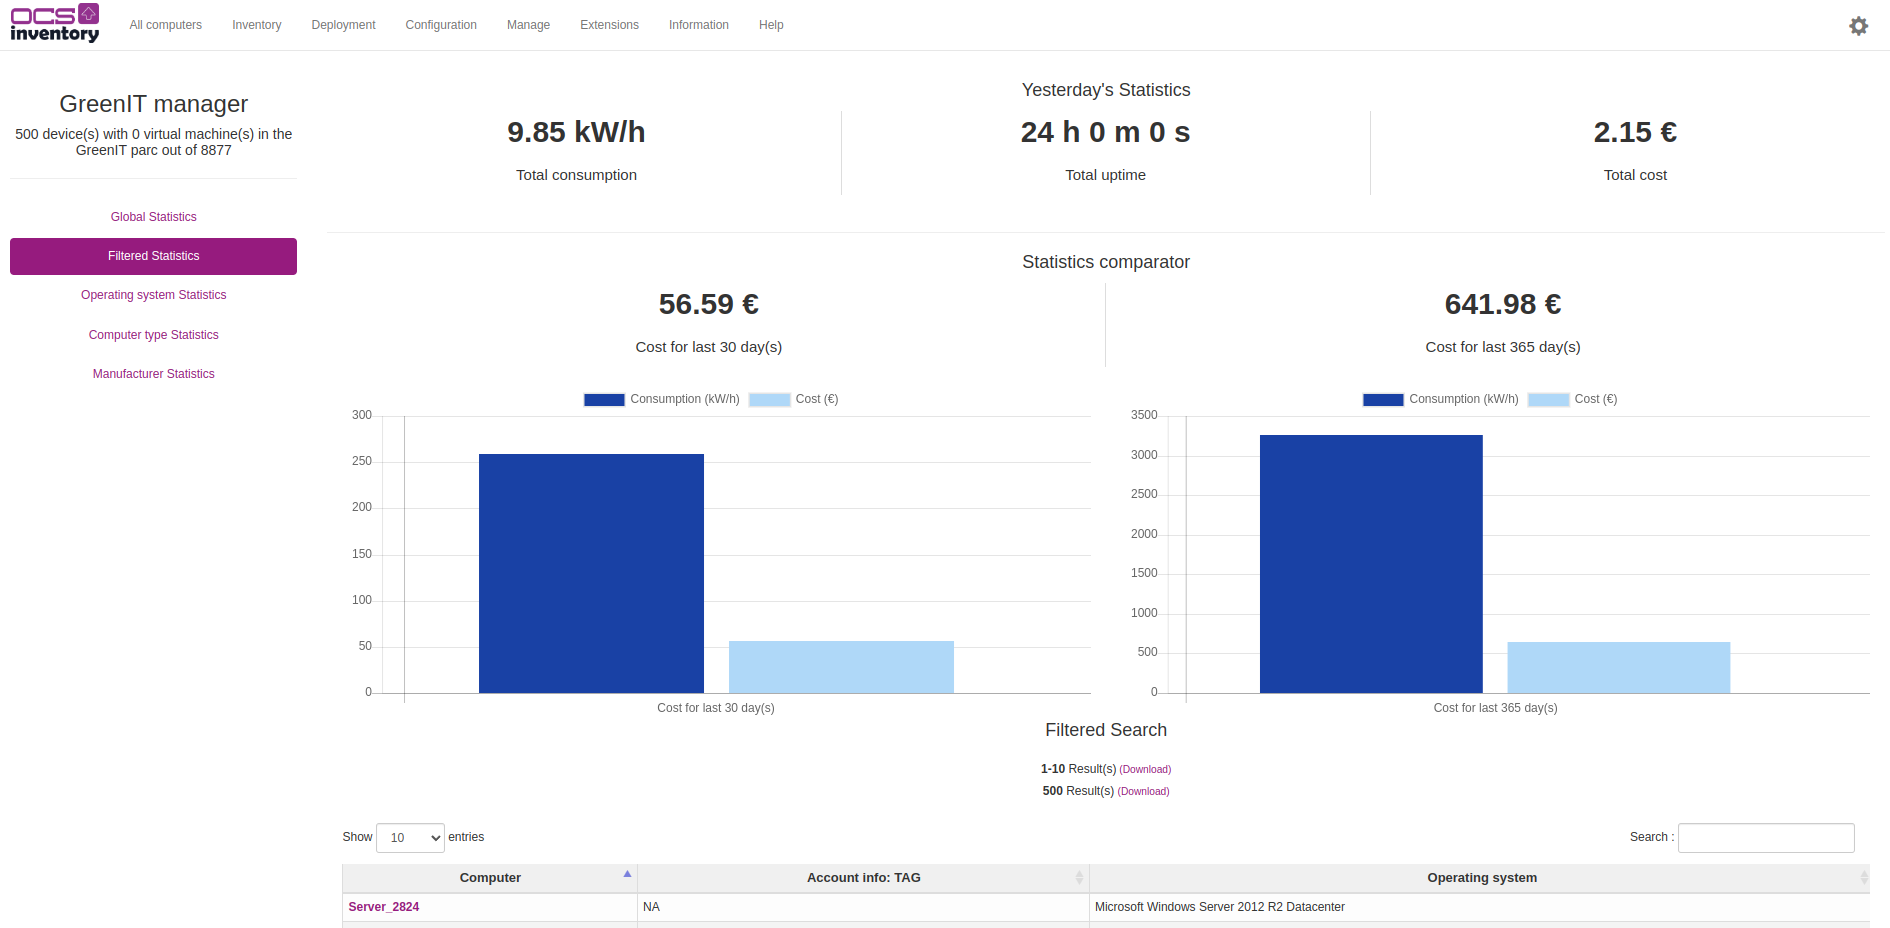
Or you can apply a filter. When applying it, a message informs you that the filter is active. Below this message, a Generate filtered stats button is displayed.

When clicking on this button, the page will display a similar view to the Global Statistics view but with filtered data:
Operating system statistics
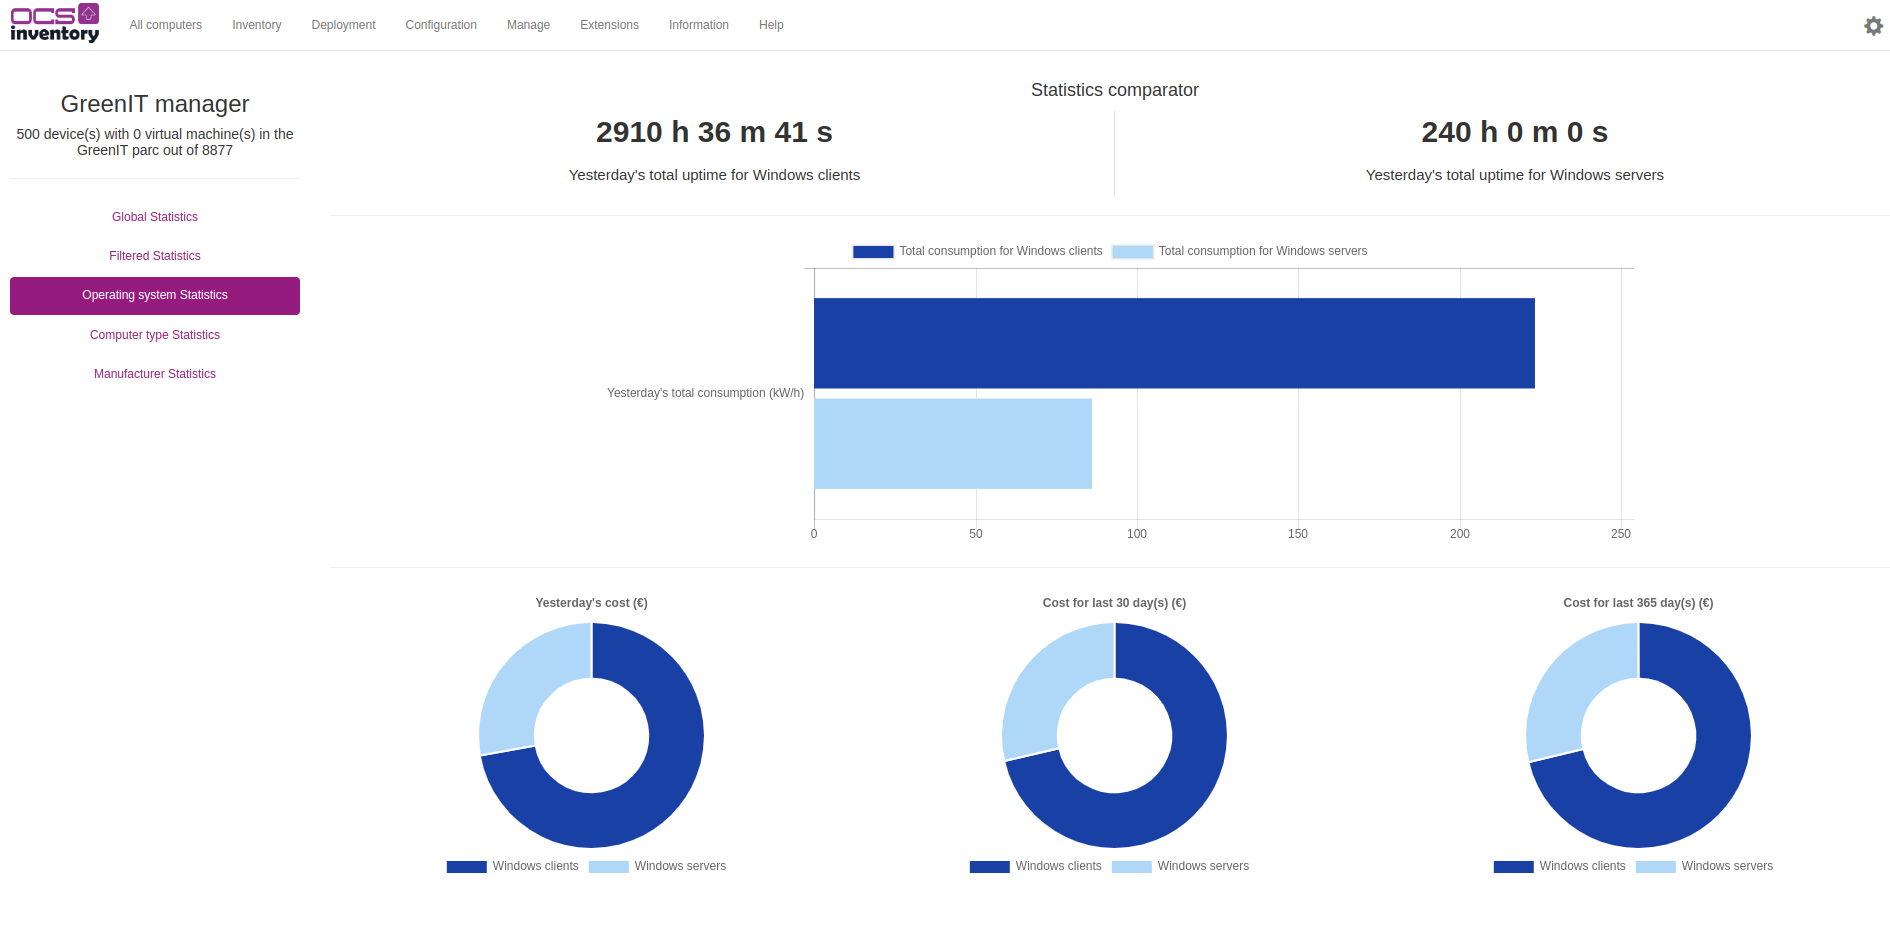
The operating system statistics view is a preset to compare Windows clients and servers.
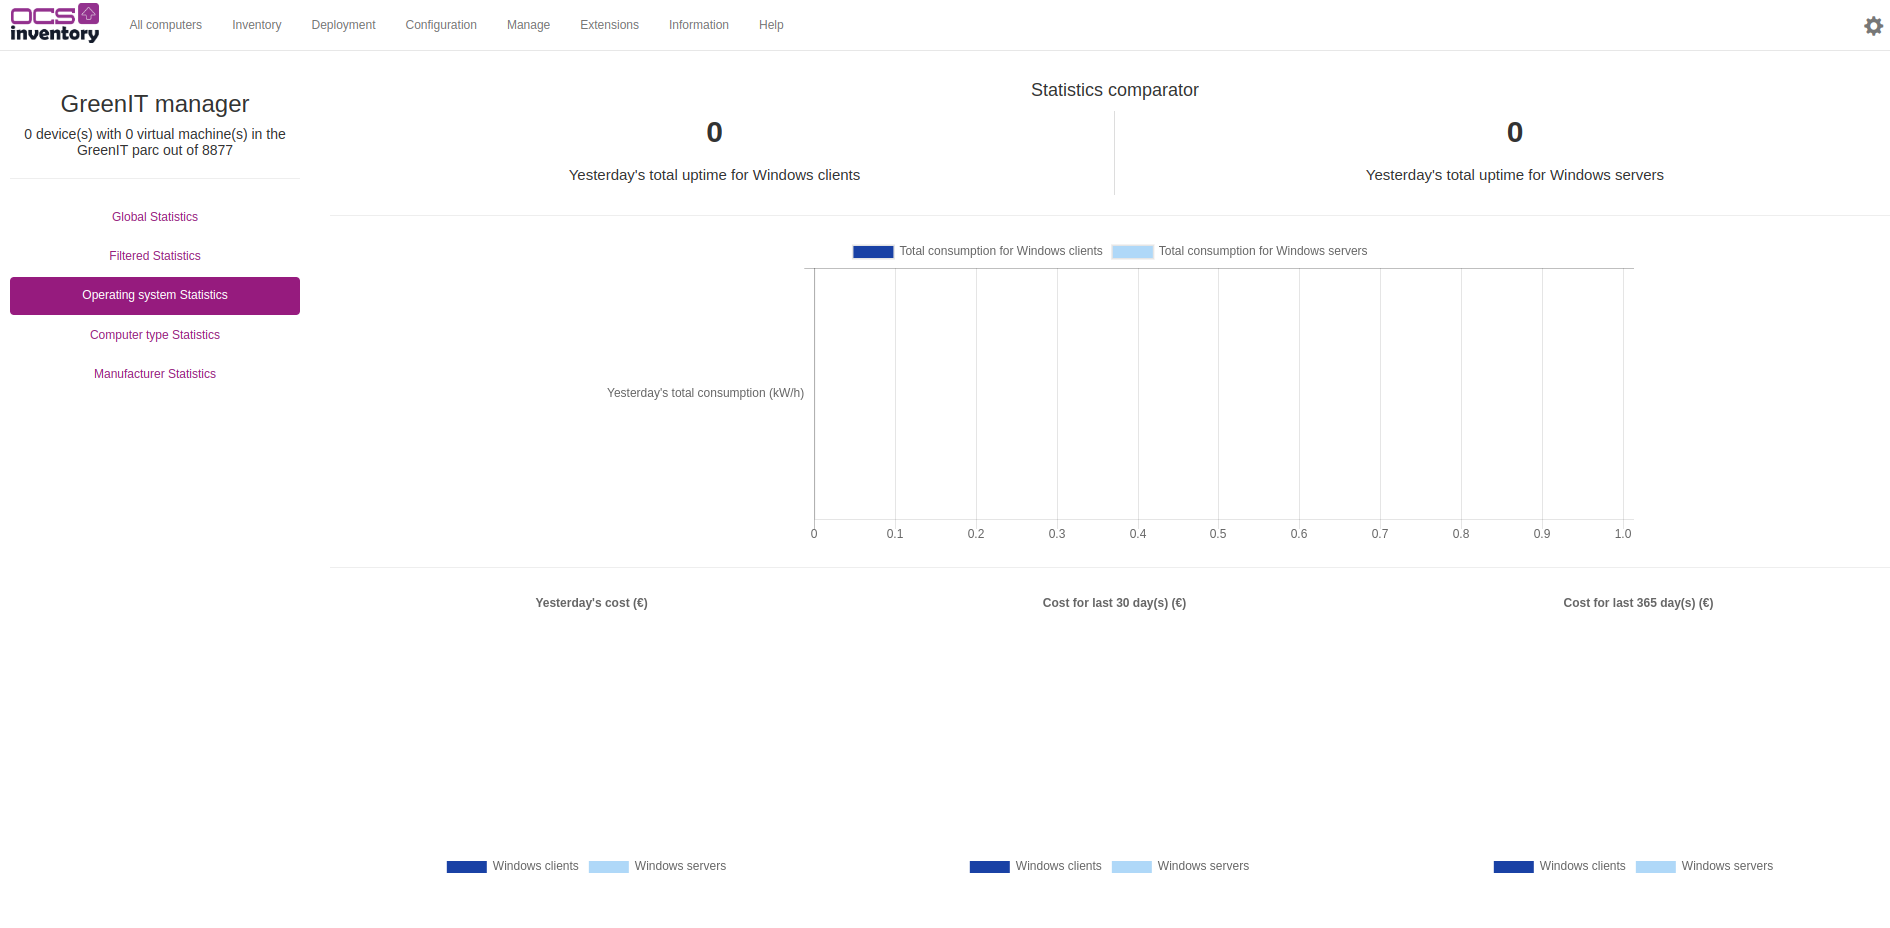
This view is split into 2 parts: - D-1 uptime and total consumption - 3 doughnut diagrams of cost per operating system (D-1, period X, period Y, which are configurable in the configuration page of the plugin, see dashboard configuration)
Example of operating system stats view with data:
Computer type statistics
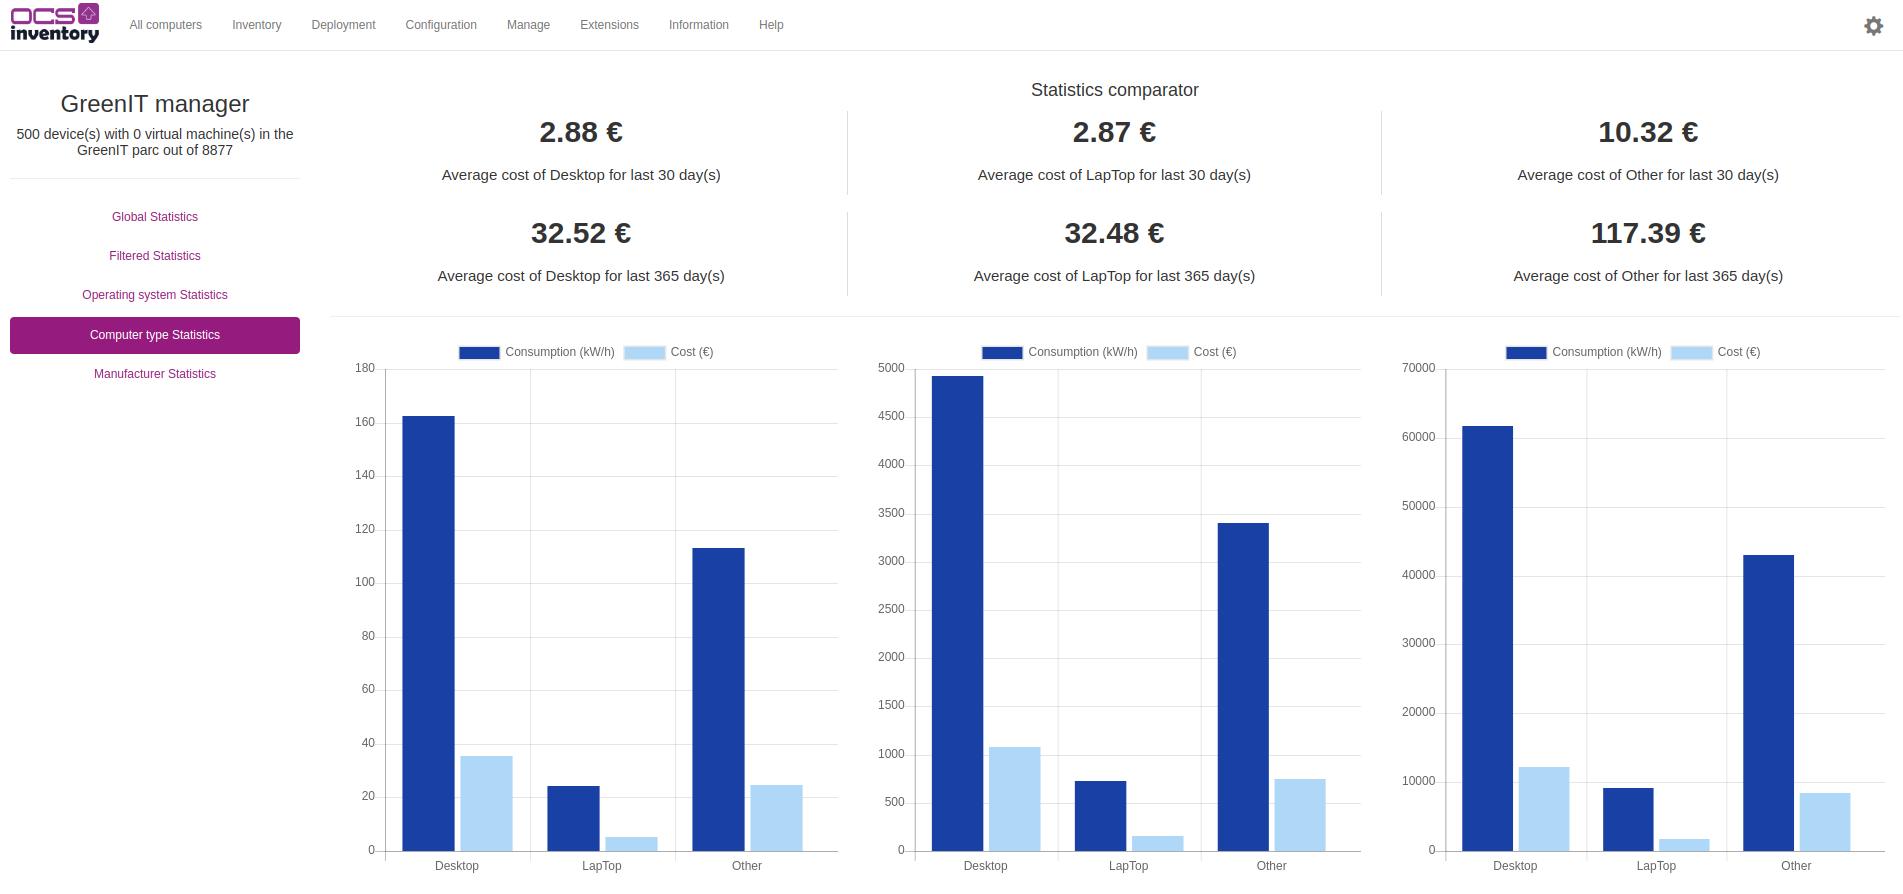
This view is a preset comparing the consumption of 3 different types of assets: - Desktop - Laptop - Other

This view has 2 parts: - The first part cannot be displayed if there is no data available. Statistics show the average cost per computer type for period X and Y. - The 3 vertical bar diagrams on the second part show the total consumption and cost per computer type.
Example of computer type stats view with data:
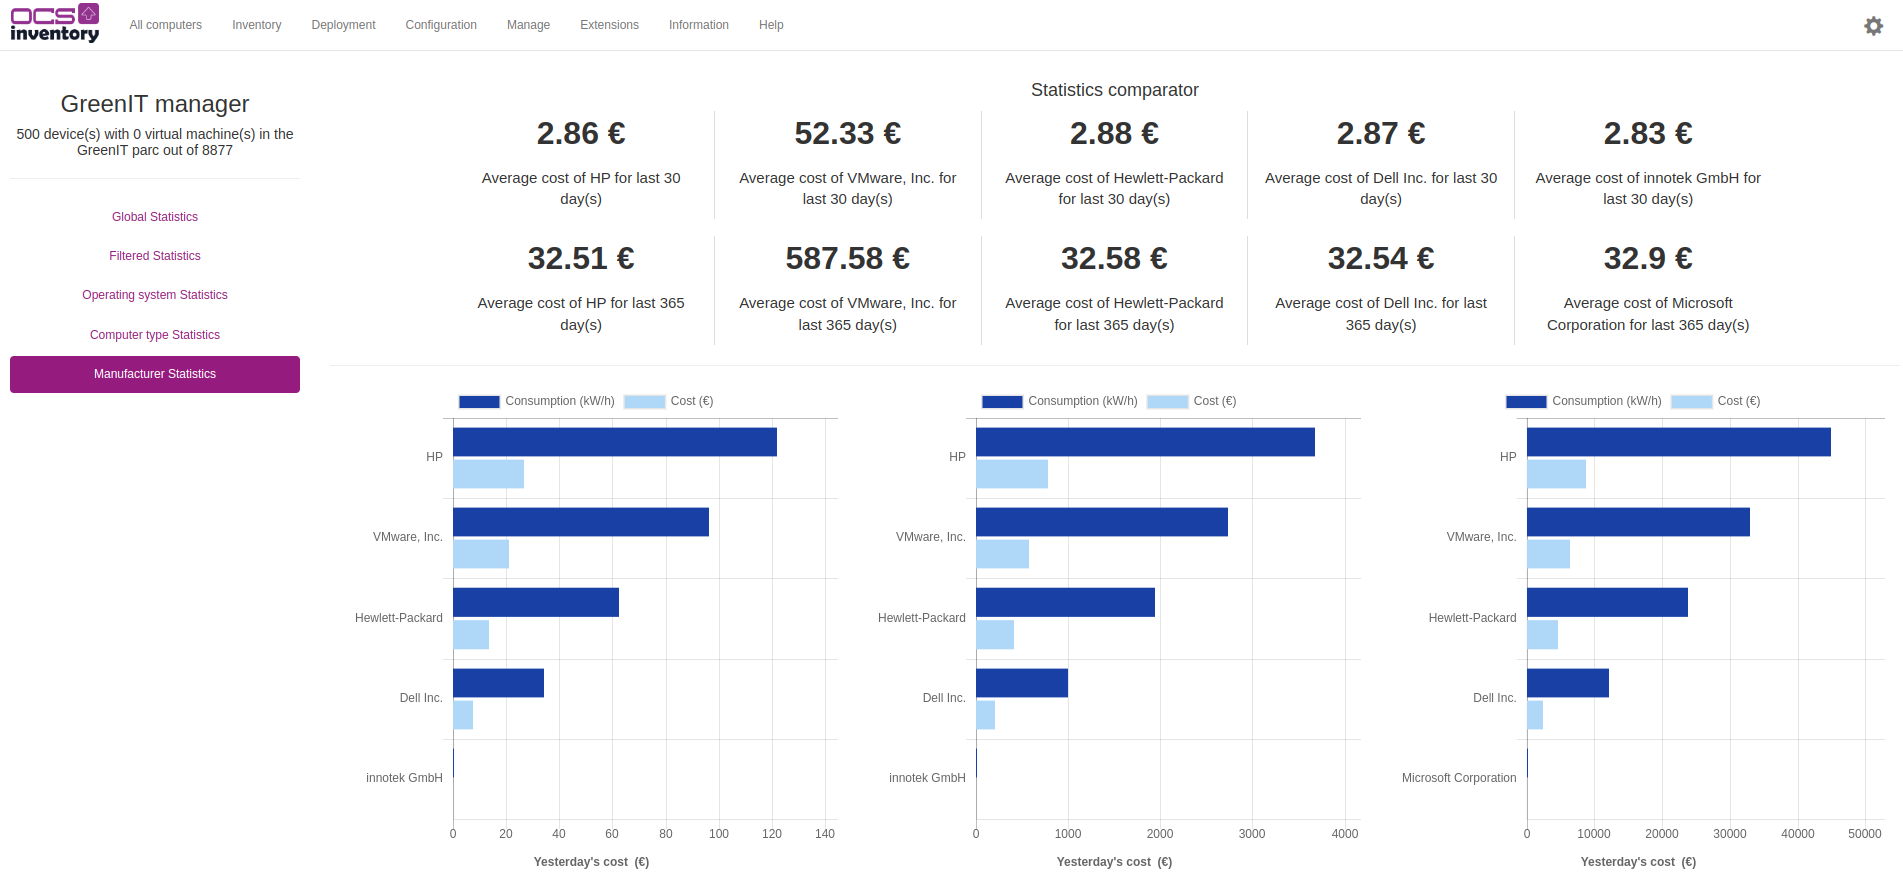
Manufacturer statistics
This preset shows the consumption for the 5 first manufacturers with the highest consumption.
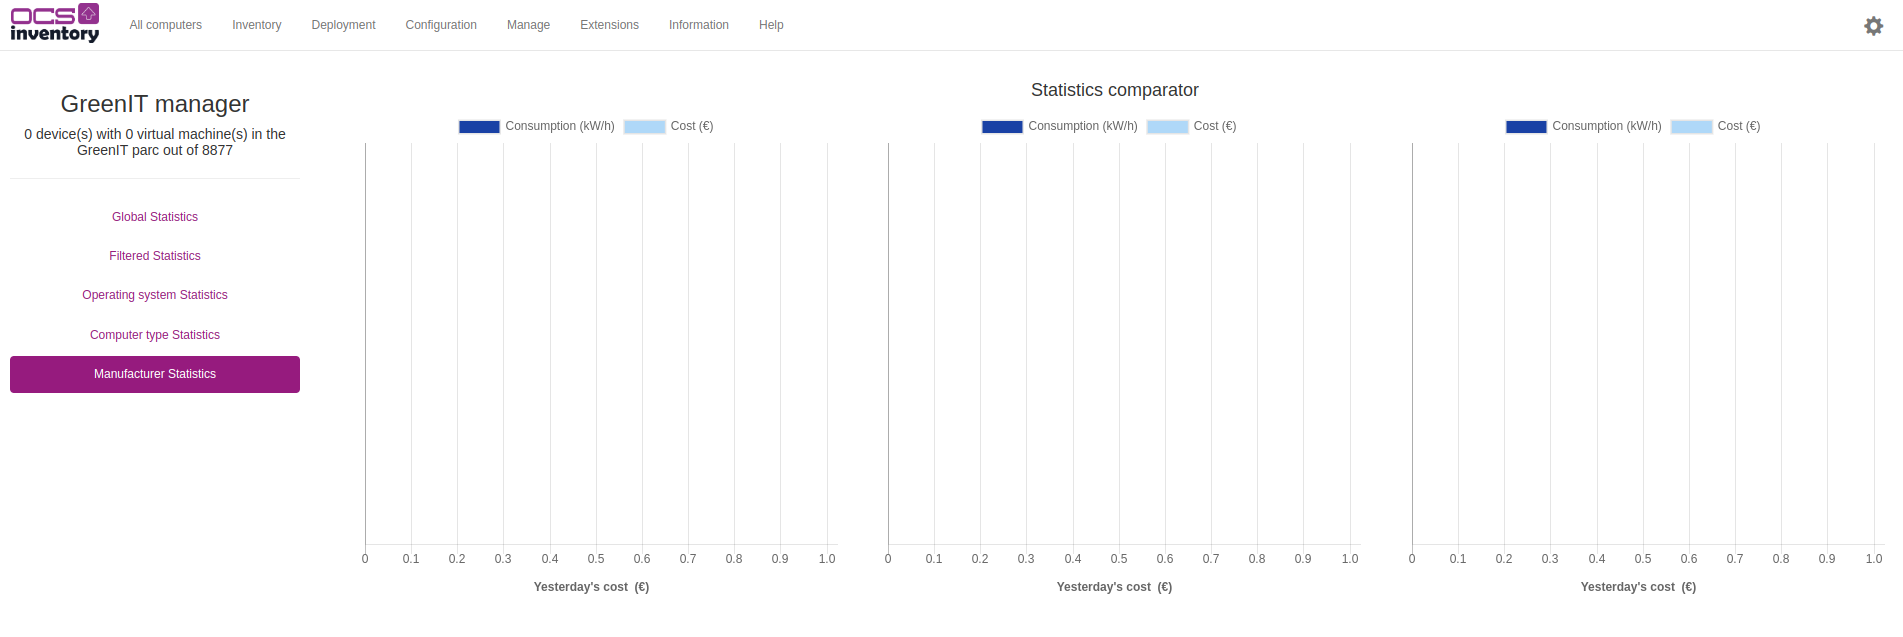
This view follows the structure of the Computer type statistics view: - The first part cannot be displayed if there is no data available. Statistics show the average cost per manufacturer for period X and Y (limited to 5 first manufacturers with the highest consumption). - The 3 honrizontal bar diagrams on the second part show the total consumption and cost for the 5 first manufacturers with the highest consumption.
Example picture of manufacturer statistics view with data: